
How to Calculate Holding Costs for Real Estate Investments
You can have a clean purchase, a sensible rehab budget, and a buyer lined up, then watch the deal slip because the property sat one month too long. The mistake usually isn't the exit price. It's the carry, the interest meter, the utility bills that kept running, the insurance that didn't pause, and the timeline that stretched while everyone waited on one more approval.
That's why how to calculate holding costs is a deal skill, not an accounting exercise. In real estate, holding costs eat margin while money is tied up, and the longer a project sits, the more expensive that capital becomes. Industry guidance on carrying costs frames them as the combined annual cost of capital, storage, handling, insurance, taxes, shrinkage, obsolescence, and overhead, which is why the math is usually expressed as a percentage of inventory or asset value rather than a fixed dollar figure (Cleverence).
Why Holding Costs Quietly Kill Deal Margins
A flip can look great on paper on day one and ugly by closing table day 150. The purchase price still looks fine, the rehab budget hasn't changed much, but the carry kept accumulating while the house sat in limbo. That's how a deal that should've been a clean spread turns into a thin-margin grind.
The trap is that holding costs don't arrive as one obvious bill. They show up in pieces, interest accrues daily, utilities keep humming, property taxes don't care that the project slipped, and the insurance clock keeps ticking. In carrying-cost terms, you're paying for the asset every day it sits, not just for the privilege of owning it (NetSuite).
Practical rule: If a projected hold feels “close enough,” it usually isn't. Small timing mistakes matter because the cost base keeps expanding while the exit stays fixed.
That's also why investors who only track purchase, rehab, and resale miss the margin leak. The holding-cost rate is a normalization tool, it lets you compare assets and timelines on the same basis, even when the projects are very different (Cleverence). A low-turnover property can look harmless until the calendar proves otherwise.
The other issue is decision quality. When holding costs are undercounted, investors get pushed toward rushed sales, bad refinance timing, or loan terms that fit the property only if everything goes perfectly. That's not underwriting, that's hoping the schedule behaves.
Every Cost Component You Need to Track
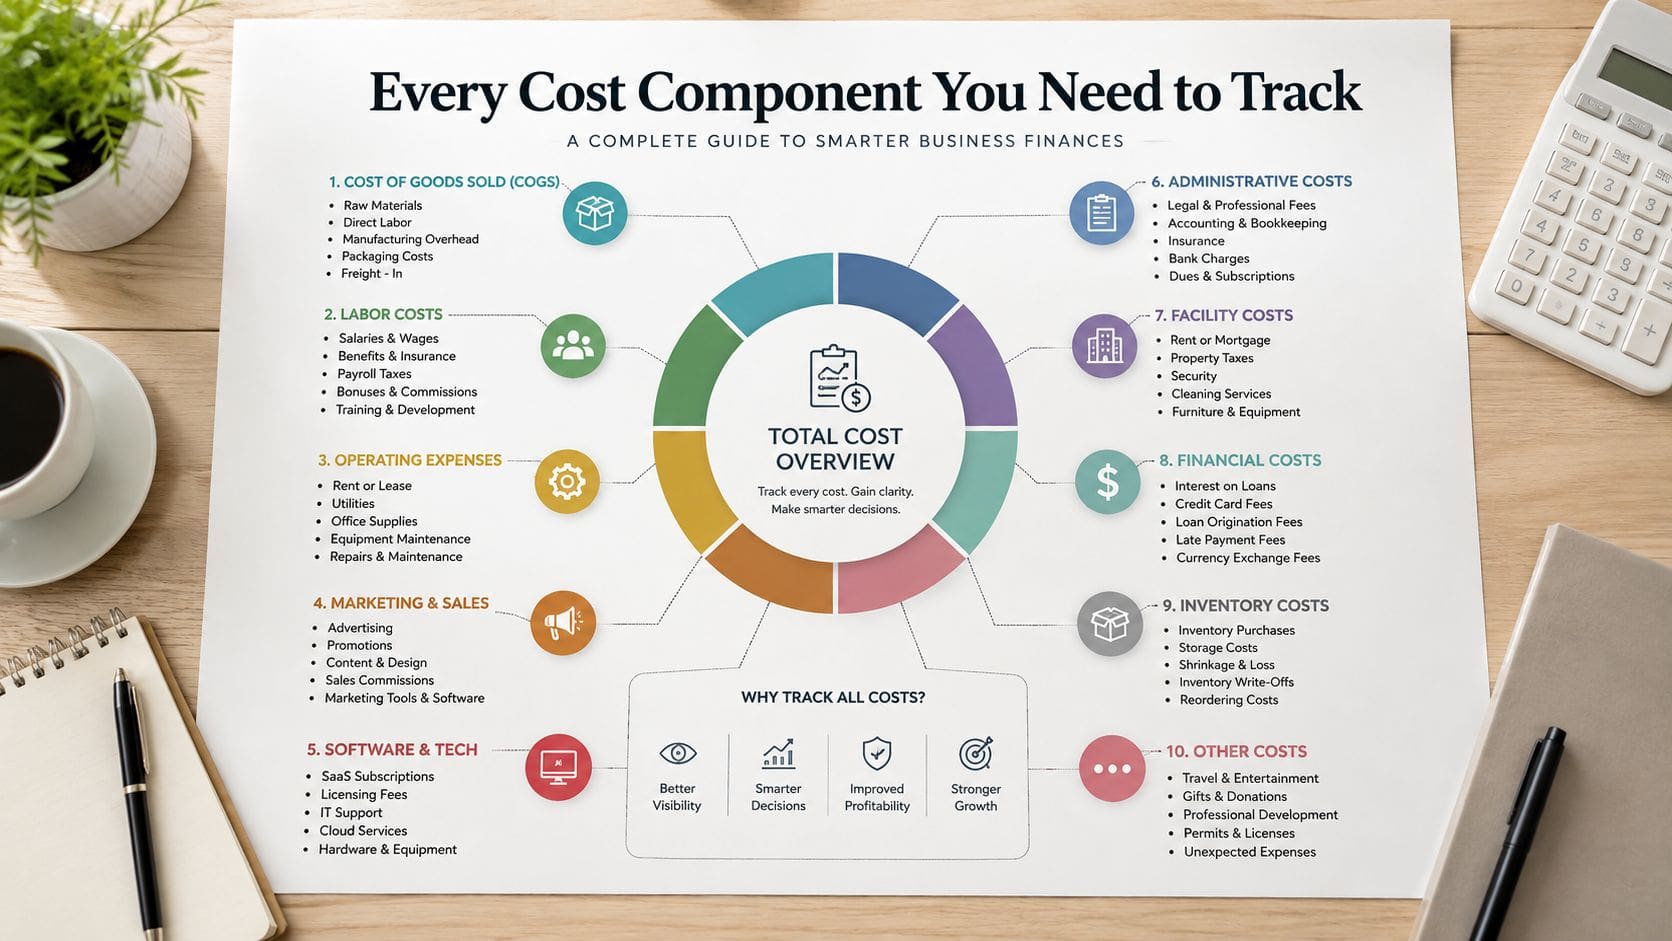
The cleanest way to build a real estimate is to stop thinking in lump sums and start tracking the buckets that move the number. A carrying-cost model typically separates capital, storage, service, and risk before annualizing each piece and dividing by average inventory value (ikoupi). That framework translates well to real estate, because the same hidden expenses show up even if the asset class changes.
Start with capital, because money has a cost
Interest on acquisition or construction debt is usually the first line item investors feel. If you borrowed to buy or build, the balance that sits outstanding is costing you every day. Even when the rate is low relative to the projected profit, the interest still compresses margin once the timeline slips.
Opportunity cost of tied-up equity is the part many investors skip. Cash tied in a project can't be redeployed into the next deal, and that matters when you're trying to compound across multiple purchases or draws. The standard carrying-cost model explicitly includes this capital component, often using the firm's borrowing rate or WACC as the annualized cost of capital (ikoupi).
Then capture the operating overhead that keeps the asset alive
Property taxes continue whether the unit is occupied or not. Insurance continues too, and vacancy or construction status can change the policy structure without changing the fact that you're paying. Those are service costs in carrying-cost language, and they're part of the standard formula (NetSuite).
Utilities are easy to underestimate on a vacant house or active site. Power, water, gas, internet, and temporary climate control can keep running because someone needs the property ready for showings, inspections, or trades. A vacant property can still burn cash.
HOA fees and special assessments are another common surprise. Investors sometimes budget the regular monthly fee and ignore the possibility of a mid-project assessment or compliance charge. If the property sits in an association, the association's calendar matters as much as yours.
Don't ignore the risk bucket
Maintenance and repairs keep compounding while the asset waits. A dripping faucet becomes water damage, deferred punch-list work turns into a second mobilization, and outdoor exposure creates new work that wasn't in the original scope.
Security, vandalism, shrinkage, and obsolescence risk belong in the model too. The inventory-management references on carrying cost explicitly include shrinkage, damage, and obsolescence as part of the annual burden (Cleverence, sourceday). In real estate, that translates into theft, weather exposure, stale finishes, and components that need replacing because the project sat too long.
Use a checklist, not memory
- Debt Carry: Track interest, lender fees, and any reserve burn tied to the loan.
- Property Carry: Add taxes, insurance, HOA dues, and association surprises.
- Utility Carry: Include every service that stays active during vacancy or construction.
- Site Carry: Budget maintenance, cleanup, trash, security, and damage control.
- Time Risk: Add permit delays, inspections, and the cost of capital being trapped longer than planned.
A useful discipline is to treat each of these as a line item you can verify, not a vague “miscellaneous” bucket. The more detailed the tracking, the less likely you are to miss the hidden cost that wrecks the spread.
The Formulas Behind Accurate Holding Cost Calculations
The core math starts with the standard annual formula, annual holding cost = average inventory value × holding cost rate (Cleverence). The rate itself is usually derived by dividing total annual carrying costs by average inventory value and converting it into a percentage, which is why the output is normally expressed as a percentage rather than a raw dollar number.
For real estate, that same logic works if you swap in the property or project basis you're carrying. The key is to use an average value over time, not a single point-in-time estimate, especially when the balance or asset value moves during rehab or draws. A common pitfall is using beginning or ending value only, which distorts the result when the project is volatile (ikoupi).
The practical formula stack
| Formula | Best For | Example |
|---|---|---|
| Total annual holding costs ÷ average value × 100 | Finding the carrying-cost rate | Use this when you want a benchmark percentage for the full project |
| Average value × carrying-cost rate | Annual holding-cost dollars | Helpful when you already know the rate and want the annual burden |
| Annual holding cost ÷ 12 | Monthly burn estimate | Good for pro formas and lender conversations |
| Monthly cost ÷ 30 | Daily burn estimate | Useful when a closing or permit delay adds a few extra days |
| Per-unit carrying cost × average units held | Inventory-style annualization | Helpful when you model materials or repeated draws |
A simple workflow keeps the math honest. First, define the valuation base for the period. Second, quantify each bucket in dollars. Third, sum the annual carrying costs. Fourth, divide by the average annual value and multiply by 100 to get the rate (ikoupi).
Useful habit: Build the model monthly, even if the benchmark is annual. Monthly tracking catches timeline drift before it turns into expensive surprise.
For quick planning, many guides describe carrying costs in the rough range of 20% to 30% of value, and some planning references use about one-quarter as a shortcut when a fast approximation is needed (Cleverence, NetSuite). That's not a substitute for real math, but it is a sanity check when a pro forma lands far outside the expected band.
Real-World Sample Calculations for Three Deal Types
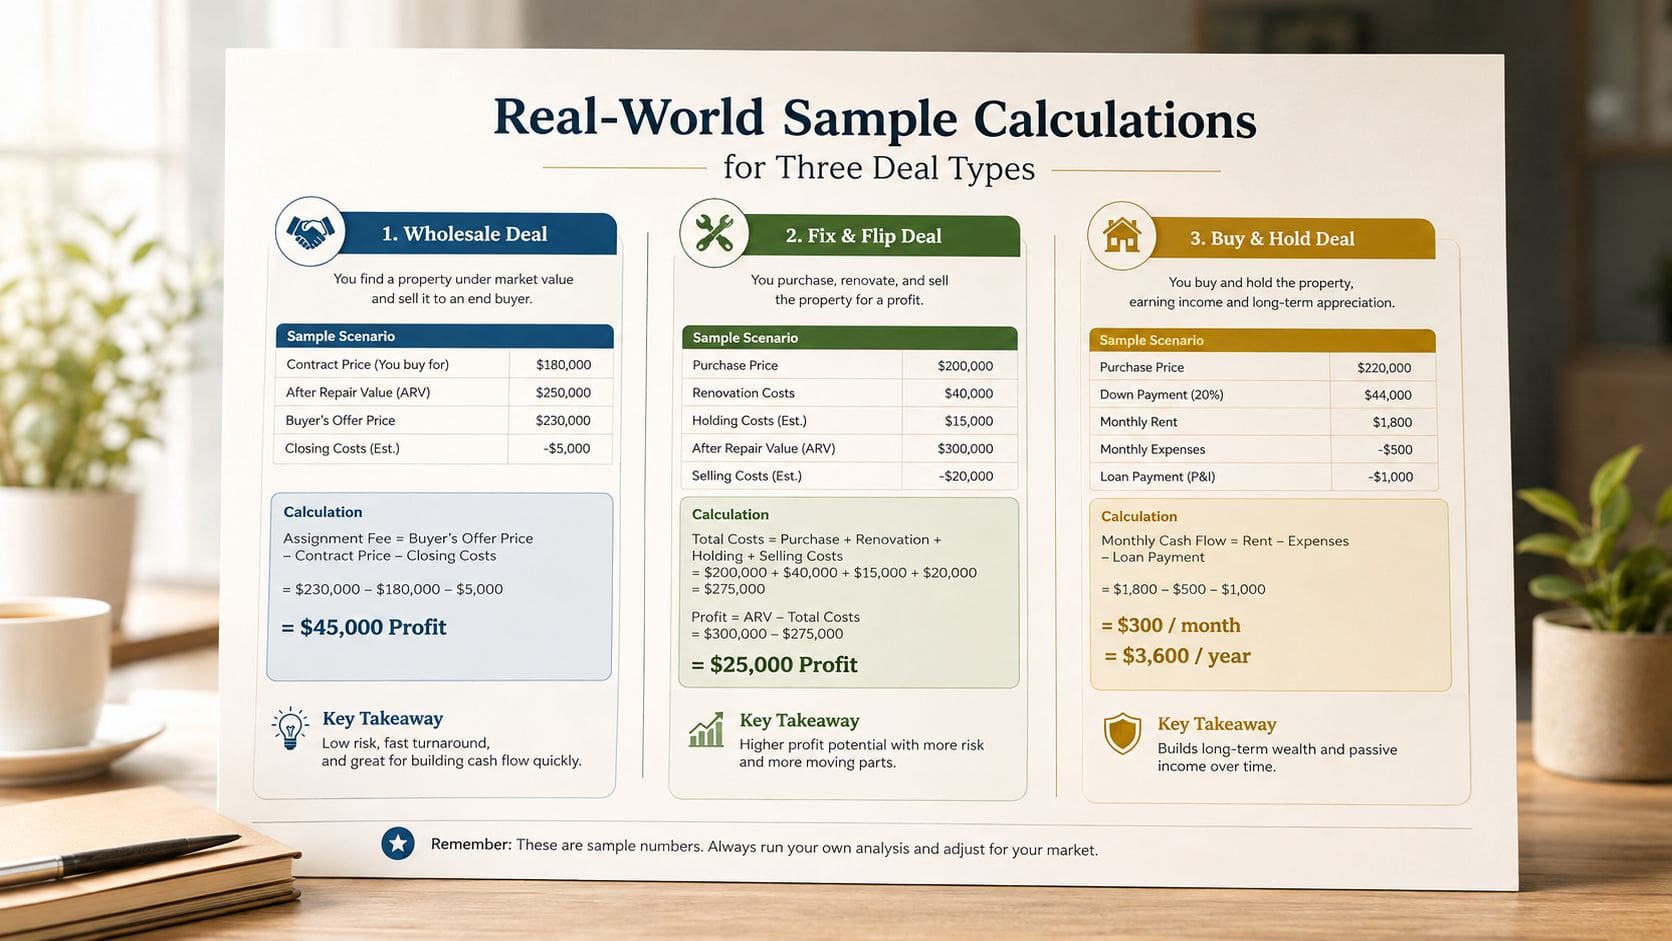
A good model gets sharper when you apply it to actual projects, not abstract templates. The numbers below are illustrative deal math, not promised financing terms, but they show where holding costs usually pile up and why timeline discipline matters.
Fix and flip with a 120-day hold
Start with acquisition debt, then layer in the recurring carry. If the loan accrues interest every month, that's the anchor cost. Then add taxes, insurance, utilities, and maintenance. On a flip, those smaller charges often look trivial until you extend the hold, because they keep adding while the resale date slides.
A hard-money style hold also magnifies the time factor. The difference between a clean exit and a delayed one is rarely just one bill. It's the whole stack of carrying expense continuing for another cycle. For a simple deal review, many investors sanity-check the economics with a dedicated flip calculator before they write the offer, and a practical reference point is the fix-and-flip calculator.
Ground-up construction with draw-based financing
Construction changes the math because the balance doesn't always stay static. Early in the project, the exposure can be lower, then each draw increases the amount of capital carrying cost you're paying against. That means the burn rate often rises as the build progresses, especially if inspections, material delays, or weather slow the schedule.
The important move is to model carry against draw timing, not just total budget. If trades finish late or an inspection gets pushed, the lender's interest reserve may get consumed faster than planned. That's where a project that looked stable on paper starts to pinch. The capital bucket in the standard carrying-cost framework is the piece that usually drives the pain first (ikoupi).
Bridge to DSCR rental transition
Hidden holding cost becomes a financing issue, not just a project issue. A rental conversion often needs time for rehab, lease-up, and stabilization before it can refinance cleanly into long-term debt. During that bridge period, the owner is still paying carry, and the property isn't yet producing the rent profile needed for the takeout.
That's why DSCR-oriented underwriting pays attention to timing. If the asset needs a longer stabilization window, carrying costs can eat reserves and weaken the refinance story. The practical question isn't just whether the deal works, it's whether the carry can be absorbed until the property is ready for long-term cash-flow underwriting. A DSCR reference tool can help frame that exit math, and the relevant planning page is the DSCR loan calculator.
How Holding Costs Shape Your Financing and DSCR Decisions
Carrying costs don't just reduce profit, they affect whether the deal reaches the refinance line in the first place. A lender looking at a takeout loan cares about stabilized cash flow, reserve sufficiency, and whether the property can support the debt service after the rehab phase. If holding costs consumed too much of the budget during the bridge period, the refinance can get tighter even when the asset itself is solid.
That's especially true when the project relies on a bridge-to-perm path. The longer the hold, the more interest reserve gets spent and the less room there is for slip in lease-up or appraisal timing. In practical underwriting, the investor is always balancing two clocks, the project schedule and the debt schedule.
Practical rule: Underwrite the refinance as if the project will take longer than the optimistic case. If it still works, you've probably got a safer deal.
DSCR qualification is sensitive to timing because the income has to be there when the loan converts. If carrying costs push stabilization back, the property may not show the cash flow profile the lender expects at the moment of review. That's why a delayed exit can pressure debt service coverage even when the rent target itself hasn't changed.
For investors comparing options, bridge structure matters. The right short-term loan should leave enough room for the actual hold, not just the ideal one. A refinance calculator can help pressure-test the exit, and the relevant planning tool is the construction loan interest rates page when you're comparing carry against project pace and takeout timing.
Practical Ways to Reduce and Forecast Holding Costs
The fastest way to lower holding cost is to stop losing time to avoidable delays. File permits early, schedule inspections before crews are waiting, and line up insurance effective dates so they match the actual project start instead of sitting idle. Vacancy utilities should be planned, not guessed at after the first bill arrives.
I also like to build a simple monthly forecast that compares projected carry against actual carry. When the gap opens, you know something in the schedule is slipping, and you can decide whether to accelerate, renegotiate, or cut scope before the budget gets boxed in. That kind of discipline matters more than trying to shave a tiny cost after the problem is already live.
Use a contingency buffer in every pro forma. Not because you expect failure, but because the timeline always has more friction than the original spreadsheet admits.
If you want to pressure-test the cost of debt before your next project, review the financing assumptions with Sims Ventures and compare them against your hold timeline. The investors who protect margin best are the ones who model the carry early, track it monthly, and treat every extra day as a decision, not a surprise.
If you're lining up your next flip, rental refinance, or ground-up build, use Sims Ventures to sanity-check the financing against your actual hold timeline before you close. Their asset-based approach is built for investors who need speed, flexibility, and a deal structure that respects carrying costs instead of ignoring them.
